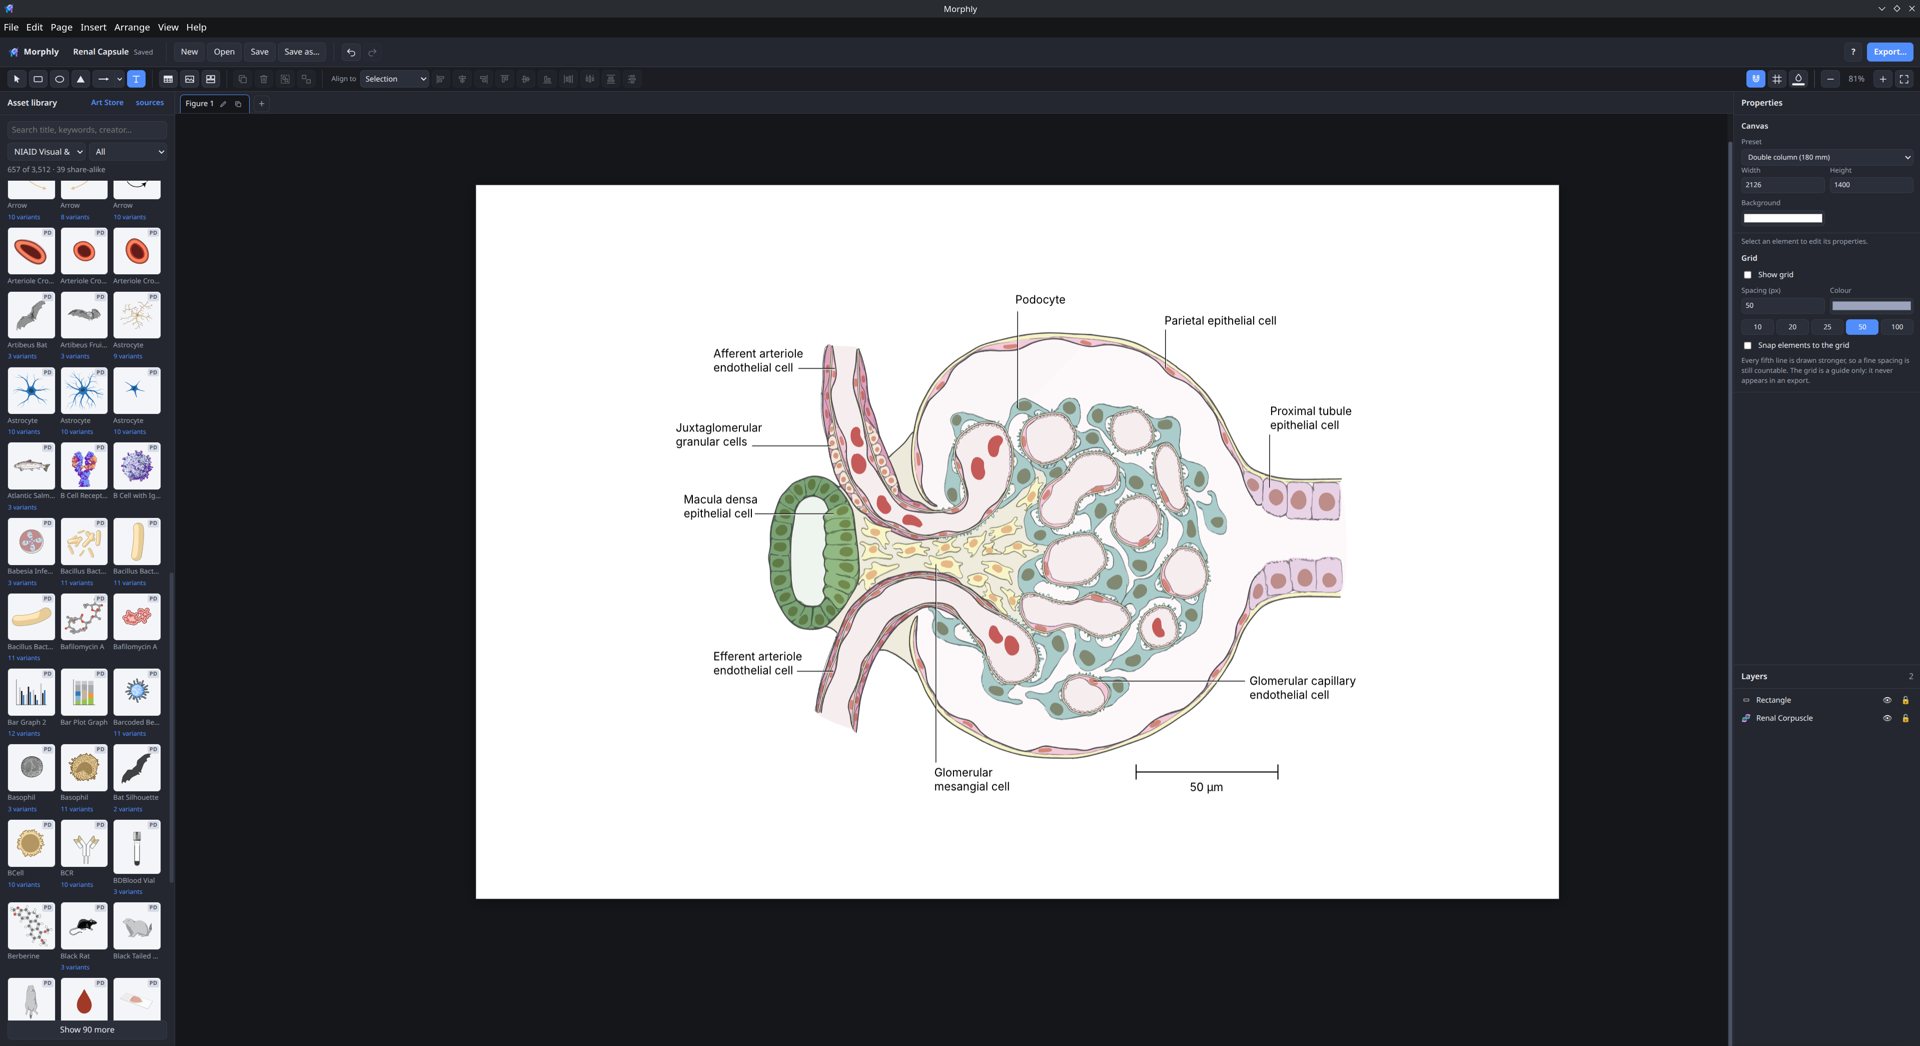
Twenty thousand drawings, searchable offline.
NIH BioArt ships inside the app. Five more libraries wait in the built-in Art Store, from organism silhouettes to pathway icons, each checked on download and labelled with its licence.
A desktop figure editor built on thousands of openly licensed illustrations of cells, viruses, organs, molecules and lab equipment, with graphs and statistics from your own data. Draw the schematic and plot the numbers on one canvas, then export high-resolution PNG or JPEG, or vector SVG and PDF ready for journals.
No account, no subscription, completely local. Windows, macOS and Linux.
Illustrate the experiment, plot the results, run the tests and lay it all out as journal panels, in one program and one file.
NIH BioArt ships inside the app. Five more libraries wait in the built-in Art Store, from organism silhouettes to pathway icons, each checked on download and labelled with its licence.
Change one colour and every shape using it follows, or double-click to edit a single piece. Try it:
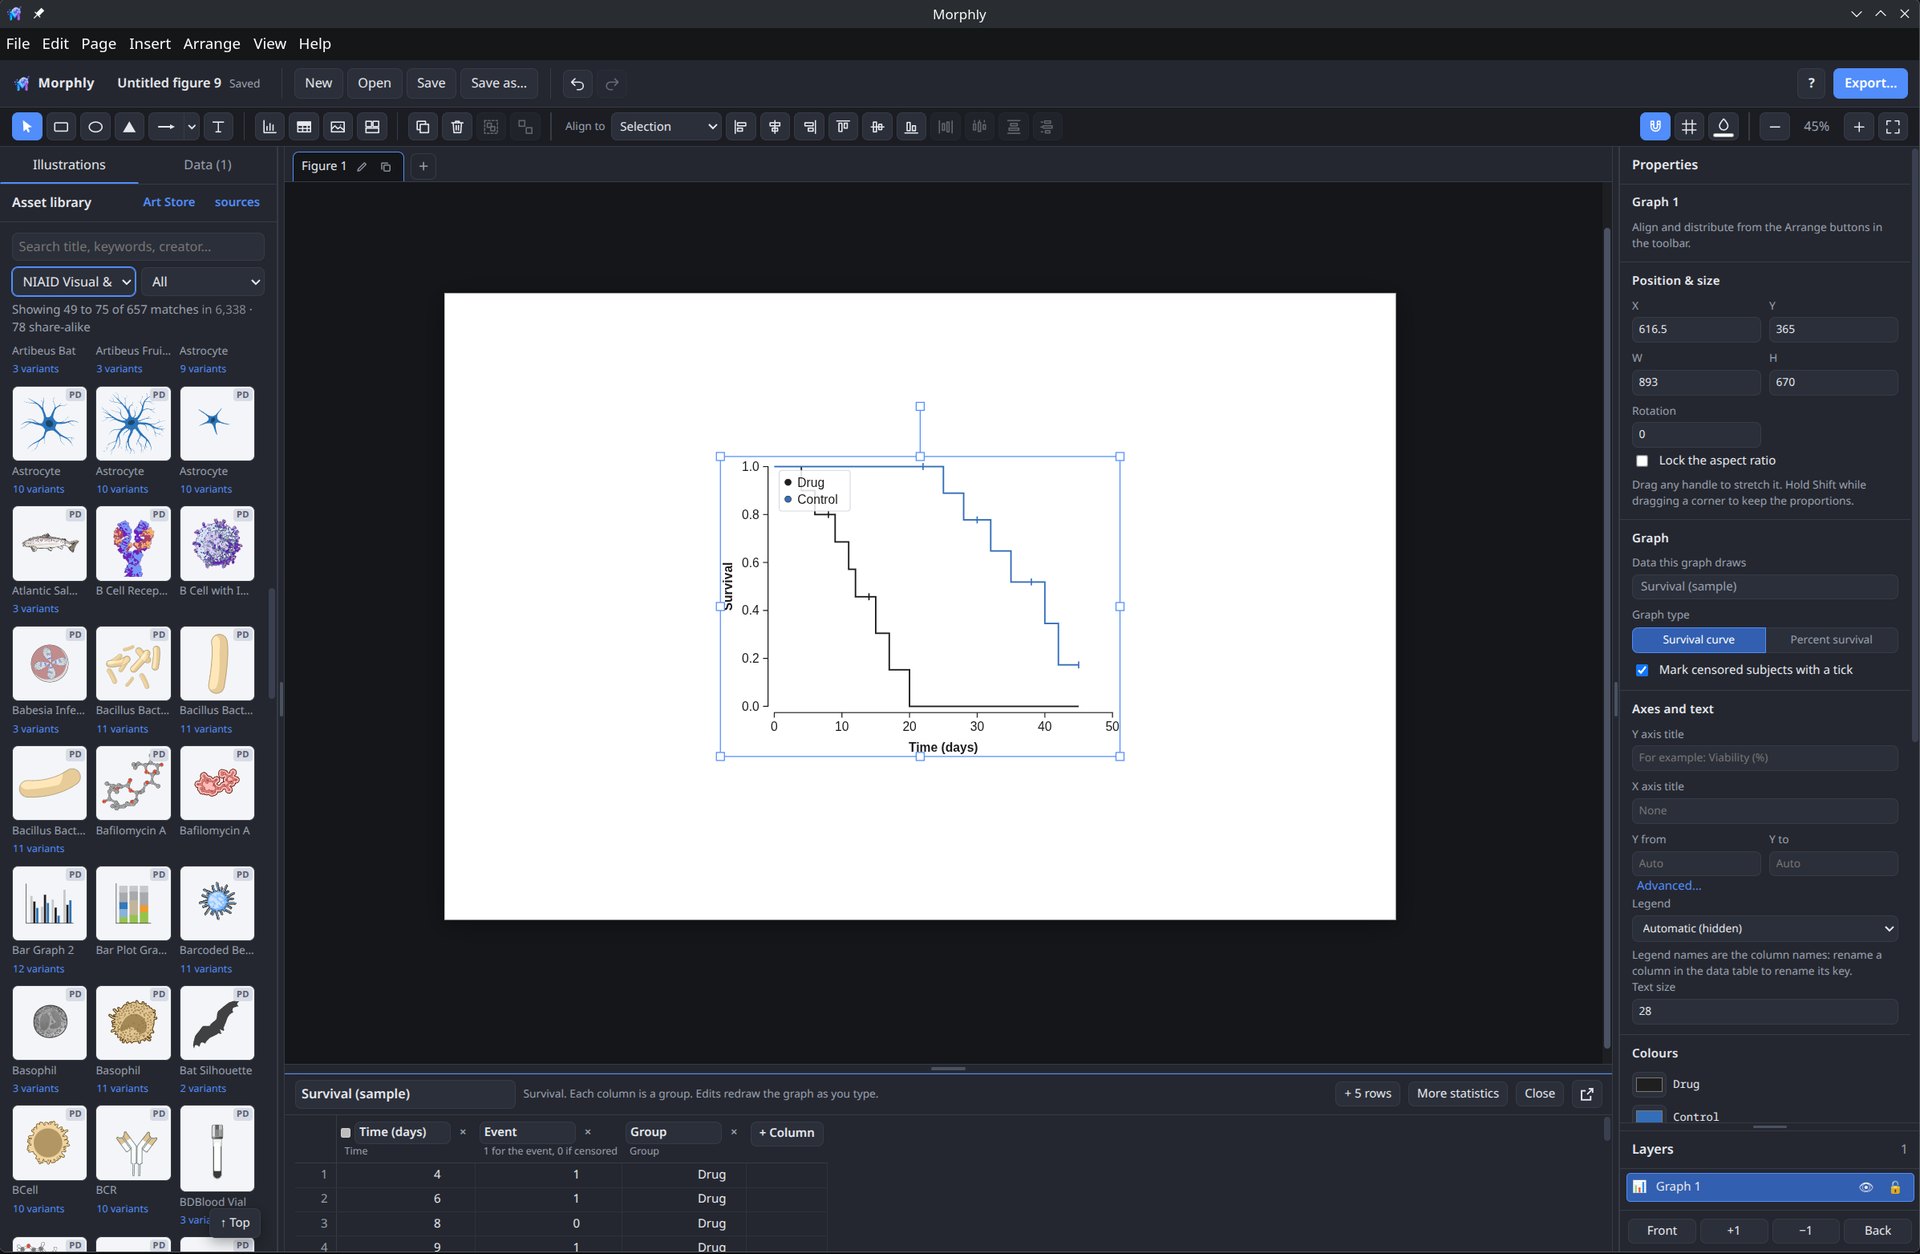
Bar charts with every point, box and violin plots, SuperPlots, dose response curves with IC50, Kaplan-Meier survival, heatmaps, PCA, ROC, volcano and UpSet plots. The data lives in the figure file, so change a number and the graph redraws.
Morphly suggests a test and says why, draws the comparisons as brackets with stars, and writes a methods sentence for your manuscript. Each test is documented with the R command it was checked against.
Split a page into panels with automatic A, B, C labels and even spacing, the way journal figures are laid out.
Type or paste numbers under the canvas and the graph redraws as you go. Several graphs can share one table.
Kaplan-Meier curves with log-rank tests and hazard ratios, and fitted dose response curves with IC50 and a confidence band.
Volcano and MA plots, clustered heatmaps, PCA, correlation matrices and UpSet plots, straight from a results table.
Making a figure for a paper usually means paying for a subscription or fighting general vector software that knows nothing about biology. Morphly is a third option.
| Morphly | BioRender | GraphPad Prism | |
|---|---|---|---|
| Price | Free, open source (MIT) | Paid plans for publication use | Paid licence |
| Where it runs | Desktop, fully offline | In the browser, with an account | Desktop |
| Unpublished work | Never leaves your machine | Stored online | Stays local |
| Scientific illustrations | NIH BioArt built in, more as Art Packs | Proprietary library | Not its focus |
| Graphs and statistics | 20+ graph types, tests checked against R | Basic charts | Its specialty |
| Illustrations and graphs together | On one canvas, in one file | Illustration first | Graphs only |
Based on each product's public information in 2026. Plans and features change, so check their sites for current details.
Every illustration carries a badge in the library. Morphly writes the credits for you and warns you before exporting anything with strings attached.
Use it anywhere, for anything. Credit is appreciated but not required. Most of NIH BioArt is here.
Credit the artist. Tick "Append asset citations" on export and the correctly formatted credits are written into your figure.
Credit required, and your figure may have to carry the same open licence. Fine for open access, worth a thought otherwise.
The canvas editor, vector recolouring, several figures per file, the Art Store, and builds for Windows, macOS and Linux.
Glue points, curved and elbow connectors, smart guides, editing parts of a drawing, SVG import, panel layouts, autosave and crash recovery.
Eight data shapes and twenty-odd graph types, from bar charts with every point to Kaplan-Meier, heatmaps, PCA and volcano plots, with every statistical test checked against R. Also rich text formatting, resizable panels, JPEG export, and an asset library that loads as you scroll. 0.5.2 keeps the built-in library across launches on Linux, stops prefixed artwork being dropped as blank, and mirrors a selection left to right or top to bottom.
Filter, combine, pivot, summarise and join tables inside Morphly, each step showing the R it matches. Dendrograms beside a heatmap and confidence ellipses on a PCA. Elements that draw themselves from your numbers: plasmid maps, gel lanes, multiwell plates and sequence tracks, editable as data rather than as paths. And a layout that is easier to pick up.
An MCP server, so assistants such as Claude Code and Codex can build figures on request: search the libraries, place and recolour artwork, add labels and panels, load data into graphs and export. The result is an ordinary .morphly file you keep editing by hand, and it all still runs on your own machine.
Figure templates, pathway diagrams from interaction tables, and optional mixed models and Cox regression.
Pick the installer for your computer.
SmartScreen may say "Windows protected your PC". Click More info, then Run anyway.
Drag Morphly to Applications. The first time, right-click it and choose Open.
Make it executable, then run it: chmod +x Morphly-0.5.2.AppImage
The installers are not code-signed, because Apple and Microsoft charge for certificates and Morphly is a free academic project. The one-time warning is expected. Every release, and every older version, is archived on Zenodo.
Occasional short emails with product updates and review forms. Nothing else.
* Used only for Morphly updates, held by MailerLite. Unsubscribe any time.
Illustrations should be credited to their own libraries, which Morphly does on export. For Morphly itself:
Saadat, A. (2026). Morphly: a free desktop editor for scientific figures (version 0.5.2) [Software]. Zenodo. https://doi.org/10.5281/zenodo.23084681